Ranking10 carriers · Alphaliner and Sea-Intelligence · three orderings
What container shipping rankings measure, and which carrier actually keeps its schedule
Container shipping companies rankings answer three different questions with one list, and the three answers do not agree with each other. What the published measurements actually say:
- Capacity is what the carrier league table ranks. Alphaliner's TOP 100 put the world fleet at 7,615 active ships and 34,516,221 TEU on 25.07.2026, with MSC holding 21.4% of it.
- Reliability is a different publisher and a different order. Sea-Intelligence put May 2026 at 64.7% on time industry-wide, with Maersk at 78.2% and Hapag-Lloyd at 76.0% — an ordering that does not match the capacity one.
- The reliability figure itself is disputed. A Kuehne+Nagel summary gives June 2026 at 56.6% and names April the best month at 62.4%. April is the only month the two sources agree on.
- Price is a third measurement again. Drewry's World Container Index stood at $4,374 per 40-foot container on 07/25/2026, down 4% in a week.
- Rank is partly rented. ONE runs 53.1% of its capacity on chartered ships, COSCO 39.6% and Hapag-Lloyd 39.4% — tonnage the operator can hand back.
- Almost nobody says what they are ranking by. Of the 34 pages ranking for these queries, 11 name the metric, 2 show a score, 2 publish a method and none reports a sample size.
- SeaRates publishes no score of its own here, because a useful one would have to be lane-specific and that data has not been collected.
The SeaRates carrier ranking: three orderings, because there is no single one
Ocean carrier league tables collapse into one list because one list is easier to read, not because one measurement exists. SeaRates publishes three orderings instead, each named by the criterion it uses, each carrying its source and its date, and each stating how many carriers it actually covers. A carrier that comes first in one of them does not come first in the others, and that is the finding rather than a caveat.
Ranked by capacity — Alphaliner, read 07/26/2026, covers 10 of 10
| # | Carrier | Fleet TEU | Share of world fleet |
|---|---|---|---|
| 1 | MSC | 7,346,531 | 21.4% |
| 2 | Maersk | 4,729,902 | 13.8% |
| 3 | CMA CGM | 4,388,874 | 12.8% |
| 4 | COSCO | 3,645,322 | 10.6% |
| 5 | Hapag-Lloyd | 2,404,076 | 7.0% |
| 6 | ONE | 2,165,868 | 6.3% |
| 7 | Evergreen | 2,022,899 | 5.9% |
| 8 | HMM | 1,033,593 | 3.0% |
| 9 | Yang Ming | 757,240 | 2.2% |
| 10 | ZIM | 702,036 | 2.0% |
Ranked by schedule reliability — Sea-Intelligence GLP, May 2026, covers 3 of 10
| # | Carrier | On time, May 2026 | Against the industry figure of 64.7% |
|---|---|---|---|
| 1 | Maersk | 78.2% | +13.5 points |
| 2 | Hapag-Lloyd | 76.0% | +11.3 points |
| 3 | MSC | 71.6% | +6.9 points |
Schedule reliability is the ordering a shortlist actually needs, and it is the one SeaRates can publish for only three of the ten carriers above: the source names the top 13 and the figures carried into this project cover three. The seven missing rows are missing data, not weak performance, and no rank is assigned to them here.
Ranked by orderbook against existing fleet — Alphaliner, read 07/26/2026, covers 4 of 10
| # | Carrier | Orderbook as share of fleet | What it signals |
|---|---|---|---|
| 1 | COSCO | 45.2% | fastest planned growth of the four |
| 2 | CMA CGM | 39.8% | growth ahead of the market |
| 3 | MSC | 35.4% | growth on the largest base |
| 4 | Maersk | 25.4% | slowest planned growth of the four |
Ocean carriers ranked by orderbook are ranked on intent rather than on service: a high share says tonnage is coming, not that a container moves better this quarter. The column is here because capacity ordering shifts with it, and a reader comparing the first table a year from now should know which direction each row was heading.
What the three orderings do to each other
| Carrier | Capacity | Reliability | Orderbook |
|---|---|---|---|
| MSC | 1 | 3 | 3 |
| Maersk | 2 | 1 | 4 |
| CMA CGM | 3 | not published | 2 |
| COSCO | 4 | not published | 1 |
| Hapag-Lloyd | 5 | 2 | not published |
One published number for an ocean carrier hides exactly this table. The largest carrier is third on the measurement that decides whether your box arrives when it was promised, the second largest leads it, and the carrier growing fastest appears in neither reliability column. Ranking is possible on what is measured; a single ordering across all three is not, and inventing a weighted score to produce one would be the failure this page documents in others.
Who container shipping companies rankings actually name
Alphaliner's TOP 100 is the table behind almost every list, and it ranks operators by the TEU capacity of the fleet they run. On 25.07.2026 the world fleet in that table stood at 7,615 active ships and 34,516,221 TEU.
The order itself is set out above. What the same Alphaliner table carries and almost every page drops is the other two columns:
| Carrier | Chartered share of its capacity | Orderbook against existing fleet |
|---|---|---|
| ONE | 53.1% | — |
| COSCO | 39.6% | 45.2% |
| Hapag-Lloyd | 39.4% | — |
| Maersk | 38.4% | 25.4% |
| MSC | 35.8% | 35.4% |
| CMA CGM | 34.4% | 39.8% |
Ocean carriers are ranked on tonnage without regard to who owns it. ONE runs 53.1% of its capacity on chartered ships, COSCO 39.6% and Hapag-Lloyd 39.4% — a rank held partly on tonnage the operator rents and can hand back.
Ocean carriers differ in what they have on order: COSCO's orderbook equals 45.2% of its existing fleet, CMA CGM's 39.8% and MSC's 35.4%, against 25.4% at Maersk. A ranking read in isolation says nothing about which direction those shares are moving. The intermediary booking the slot is ranked separately: what the forwarder league tables measure reads 62 pages, 3 of which publish a method.
What the league table is actually measuring
Container shipping companies rankings measure fleet size, and size is a property of the carrier rather than of your shipment. Eleven of 34 pages name the metric they are ranking by; the rest reproduce the order without saying what produced it.
| Metric | Published by | What it answers | What it does not answer |
|---|---|---|---|
| Fleet size | Alphaliner | How much the carrier can move worldwide | Whether it serves your port pair |
| On-time arrival | Sea-Intelligence | How often vessels arrive as scheduled | What it costs |
| Spot rate index | Drewry WCI | What the market charges this week | What you personally will pay |
| Orderbook share | Alphaliner | Where the fleet is heading | Anything about current service |
Weekly volume in the same table is split by trade: 593,124 TEU on the Transpacific, 564,824 on Far East to Europe and 158,411 on the Transatlantic. A carrier dominant in world TEU can be a minor operator on the lane a US importer actually uses, and the global rank will not show it.
Ocean carriers publish nothing about their own reliability, which is why the second number in this article comes from a different publisher entirely.
Which carrier keeps its schedule
Maersk was the most reliable top-13 carrier in May 2026 at 78.2%, followed by Hapag-Lloyd at 76.0% and MSC at 71.6%. Sea-Intelligence measured global schedule reliability across 34 trade lanes and more than 60 carriers, putting the industry figure at 64.7% for the month — the highest of 2026 and still 1.2 points below the same month a year earlier.
| Carrier | Size rank | On time, May 2026 | Performance rank |
|---|---|---|---|
| MSC | 1 | 71.6% | 3 |
| Maersk | 2 | 78.2% | 1 |
| Hapag-Lloyd | 5 | 76.0% | 2 |
Container shipping companies do not hold the same order on both lists. MSC leads the fleet table with 21.4% of the world total and comes third on schedule; Hapag-Lloyd is fifth by size and second by performance. Across the top 13, six carriers sat in the 60-70% band and three in the 50-60% band, so the spread between best and worst exceeded 25 percentage points in a single month.
Ocean carriers are also measured by how late the late ships are: for vessels that did arrive late in May 2026, the mean delay was 5.52 days. April was better on both counts — 62.4% and 5.34 days — which is the shape of an industry that improves slowly and slips quickly.
Where the reliability figure itself disagrees
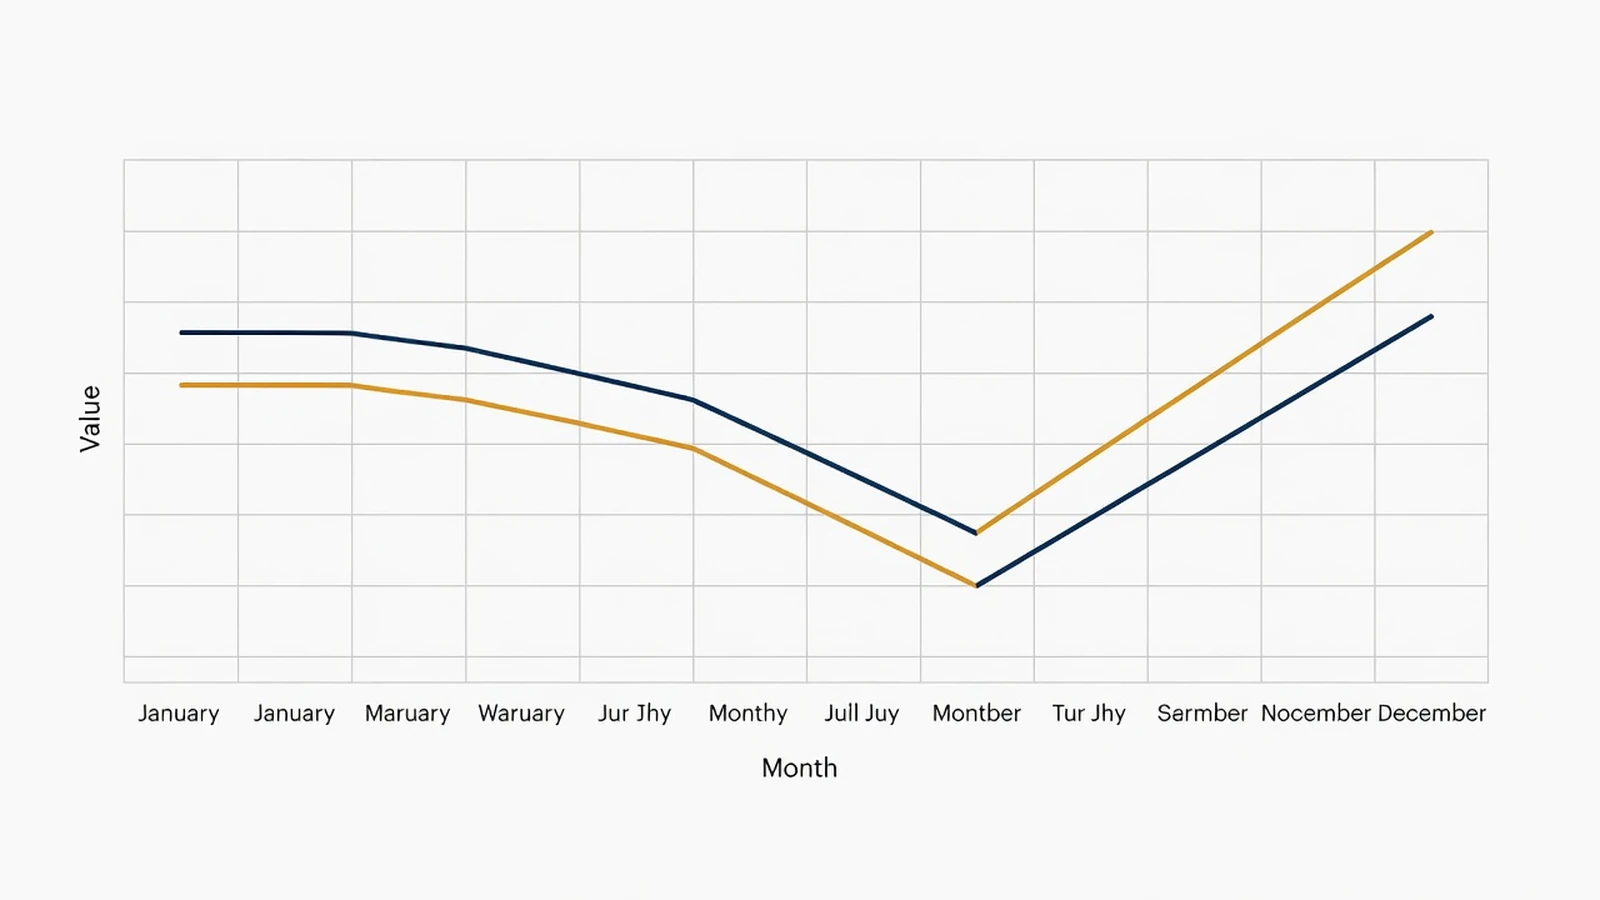
Container shipping companies rankings inherit a problem their sources have: the same period gets different numbers. Sea-Intelligence, publishing the Global Liner Performance report, puts May 2026 at 64.7% and calls it the best month of the year. A Kuehne+Nagel seaexplorer summary carried into this project gives June 2026 at 56.6% and calls April the best month at 62.4%.
April is the one month both agree on, at 62.4%. They disagree on May and on which month leads the year, which can happen when publishers count different vessel sets or different definitions of on-time. SeaRates publishes both figures with their sources rather than choosing one, and a reader comparing carriers should check which report a number came from before treating it as fact.
Carrier reliability as the two sources actually report it:
| Source | Period reported | On-time figure | Best month it names |
|---|---|---|---|
| Sea-Intelligence, Global Liner Performance | May 2026 | 64.7% | May 2026 |
| Kuehne+Nagel seaexplorer summary | June 2026 | 56.6% | April 2026, at 62.4% |
| Where they agree | April 2026 | 62.4% | — |
Neither figure is wrong; they count different vessel sets or define on-time differently. A reliability number quoted without its publisher is therefore not checkable at all.
Rate indices are a third measurement again
Container shipping companies rankings price nothing at all, and a third publisher fills the gap: Drewry's World Container Index stood at $4,374 per 40-foot container on 07/25/2026, down 4% in a week. Ocean carriers are ranked by capacity, measured by reliability and priced by an index — three publishers, three units, and no page in this corpus that connects them.
Ocean carriers get priced more carefully than they get ranked: 17 of 34 pages quote a figure and 10 date it — 29.4%, the highest rate of dated pricing SeaRates has measured in any cluster. Index journalism has the habit that ranking journalism lacks: it prints the week next to the number, because a spot rate without a week is worthless.
The Drewry index is a market average and not a quote, and ocean carriers do not sell at it. What an individual importer pays depends on volume, contract status and the forwarder in between, which is why the rate question is a different question from the carrier question: what the delivered container actually bills takes it line by line.
When the carrier's identity actually matters to you
Container shipping companies rankings never say who you will actually contract with: 2 pages of 34 mention carrier licensing at all, and none checks a company against a registry. Lines are booked by forwarders and NVOCCs far more often than by shippers directly, and most importers never sign anything with the operator whose ship carries the box. A VOCC owns or operates vessels; an NVOCC issues its own bill of lading and is licensed by the FMC; a forwarder arranges carriage as your agent.
Carriers and intermediaries differ in three practical ways: whose bill of lading governs the cargo, whose service contract the rate came from, and who is liable when the container is late or damaged. Ask which line the booking is with and which document you will receive — the answers are on the booking confirmation, and a counterparty who cannot produce them is not one to rely on.
Where an intermediary sits between you and the carrier, its credential is checkable: what the FMC registry says about this company covers how.
Whether the carrier's box is yours alone or shared changes both the liability and the arithmetic, and where the LCL saving stops sets the crossover against the destination charges.
Ocean carriers and the intermediaries standing in front of them, side by side:
| Party | Owns or operates the ship | Issues its own bill of lading | Licensed by the FMC | What binds it to you |
|---|---|---|---|---|
| VOCC — the carrier itself | Yes | Yes | No, it files tariffs instead | Its own bill of lading |
| NVOCC | No | Yes | Yes, as an OTI | Its own bill of lading |
| Ocean freight forwarder | No | No, it acts as your agent | Yes, as an OTI | The agency relationship, not a carriage contract |
The booking confirmation names which of the three you are dealing with, and the bill of lading names whose document governs the cargo. Those two answers decide who is liable before any ranking becomes relevant.
What you can do when a carrier bills you anyway
Under the FMC final rule in force since 28.05.2024, a carrier's demurrage or detention invoice must be issued within 30 calendar days of the charge arising, must go to the contracting party or the consignee but not both, and loses its force if it omits any required element. The recipient has at least 30 days to dispute it.
Ocean carriers rank badly or well on schedule, but the bill that actually reaches an importer is usually about time at the terminal rather than time at sea. That rule is the one enforceable lever a cargo owner holds without going to court, and how the demurrage and detention clock runs sets out the mechanics.
Those credentials go unmentioned by 32 of 34 pages in this corpus, and no page checks a company against a registry. Complaint data with a shipment count behind it appears nowhere, so no complaint ranking appears here either.
A carrier's demurrage or detention invoice has to clear four tests under that rule:
- Timing. Issued within 30 calendar days of the charge arising.
- Addressee. Sent to the contracting party or to the consignee, and not to both.
- Completeness. Missing any required element, it loses its force.
- Your window. At least 30 days to dispute it from the date of issue.
Three of the four are checkable from the invoice itself, before any argument about whether the delay was anyone's fault.
Ocean carriers get searched for beside the words scams, complaints, ratings and to avoid, and the honest answer is that three of those four point at a different party. A container line is not an intermediary: it files tariffs rather than holding an OTI licence, so there is no registry row to look up and no bond standing behind it. What can be checked about a line is narrow and public — its schedule reliability from a named publisher with the month attached, and whether the demurrage invoice it sends meets the four tests above.
Ocean carriers are also rarely the counterparty in a fraud complaint. The party that took the booking is, and that one is checkable: an NVOCC or a forwarder appears in the federal register with a licence number and a bond, which is the check set out under what the FMC registry says about this company. Ratings in the sense the query means do not exist here either — no publisher scores container lines on service the way review platforms score retail firms, and a complaint count without a shipment denominator would not be a rating if it did. Capacity, reliability and orderbook are what can be ordered honestly, which is why this page orders those three and labels each by what it counts.
What we measured, and how we would rank
Of the 34 pages ranking for these 54 queries, 2 show a score, 2 publish a method, and one of them — a directory, not a ranking of lines — does both. Container shipping companies get ordered publicly by an industry table and privately by nobody — the audit below is what the search result contains.
| What the page does | Pages | Share |
|---|---|---|
| Names companies individually | 29 | 85.3% |
| Names fleet capacity as the metric | 11 | 32.4% |
| Names schedule reliability | 4 | 11.8% |
| Names both metrics | 3 | 8.8% |
| Cites an industry primary source | 9 | 26.5% |
| Shows a score | 2 | 5.9% |
| Publishes a method | 2 | 5.9% |
| Reports a sample size | 0 | 0.0% |
A useful ranking for a US importer would need four rows: capacity on the specific trade, reliability on that same trade, the share of owned against chartered tonnage, and a demurrage complaint record with a denominator. The first three are published by third parties and verifiable today; the fourth does not exist in any public form, and SeaRates does not hold it.
Global carrier reliability of 64.7% is an average across 34 lanes and describes none of them. Lane-level figures are what a shortlist actually needs, and buying that data is the next step rather than a limitation of principle — which is why this page carries no score column. Each refresh of these figures is logged with its sample and its cut-off date in our dated reports on rates and regulation.
Sources
- Alphaliner TOP 100, table dated 25.07.2026 — world fleet 34,516,221 TEU across 7,615 active ships; operator capacity, chartered share and orderbook by rank. Read 07/26/2026.
- Sea-Intelligence, Global Liner Performance issue 178 (29.06.2026) and issue 177 (29.05.2026) — global schedule reliability 64.7% for May 2026 and 62.4% for April, carrier-level figures for the top 13, 34 trade lanes covered. Read 07/26/2026.
- Drewry World Container Index, $4,374 per 40-foot container, week of 07/25/2026, down 4%. Read via search results 07/25/2026.
- Federal Maritime Commission, final rule on detention and demurrage billing practices, in force 28.05.2024. Inherited from the project fact store.
- SeaRates measurement of 34 pages across 54 cluster queries, 07/26/2026. Full-text sweep, 120-word minimum.
Corrections to any figure on this page: [email protected].
Frequently asked questions
MSC, by fleet capacity: 7,346,531 TEU and 21.4% of the world fleet on Alphaliner's table dated 25.07.2026. Maersk, among the top 13 in May 2026, at 78.2% schedule reliability, ahead of Hapag-Lloyd at 76.0% and MSC at 71.6%. The industry figure that month was 64.7% and the average delay for late arrivals was 5.52 days.
Who is the largest container shipping company?
MSC, by fleet capacity: 7,346,531 TEU and 21.4% of the world fleet on Alphaliner's table dated 25.07.2026. Maersk is second at 4,729,902 TEU. Both figures measure size rather than service.
Which container line is most reliable?
Maersk, among the top 13 in May 2026, at 78.2% schedule reliability, ahead of Hapag-Lloyd at 76.0% and MSC at 71.6%. The industry figure that month was 64.7% and the average delay for late arrivals was 5.52 days.
Why do rankings of container shipping companies differ?
Because they measure different things: Alphaliner ranks capacity, Sea-Intelligence measures on-time performance, Drewry prices the spot market. A page that reproduces one table without naming the metric produces an order that cannot be checked.
Can I book directly with a container line?
Usually only with volume and a service contract. Most importers book through a forwarder or an NVOCC, which means the bill of lading and the liability may sit with the intermediary rather than with the carrier whose ship you can see.
What does a high orderbook share mean?
That the operator has ordered a lot of new capacity relative to what it runs today — COSCO 45.2%, CMA CGM 39.8%, MSC 35.4%. Orderbooks change the market's balance in future years; they say nothing about service now.
What can I do about a demurrage invoice from a carrier?
Check it against the FMC rule in force since 28.05.2024: it must arrive within 30 days of the charge, go to one party rather than two, and contain every required element. A missing element ends the obligation to pay, and you have at least 30 days to dispute.